Assessment is a key component for the school system.
How would we know if students were learning anything otherwise? Assessment
plays a critical role in teaching and learning and should have the goal of
developing independent, autonomous, and confident learners (Growing Success,
2010). Unfortunately assessment in most schools has been focused on assessment of learning. This type of assessment only measures student’s performance after
it has happened and often compares to other children’s work. This can be detrimental
because it doesn’t allow for opportunities to be independent and improve
learning. This is why schools are beginning to focus on assessment for learning
and assessment as learning. Assessment for learning involves finding evidence
for use by learners and their teachers to decide where the learners are in
their learning, where they need to go, and how best to get there (Growing
Success, 2010). Assessment as learning allows students to foster their capacity
over time to be their own best assessors but teachers start by modelling
opportunities for students to assess themselves (Growing Success, 2010). These
last two forms of assessment are much more beneficial because they allow
students to guide their own learning and have some say in the process. A key
part of this process is creating learning goals and success criteria in the
classroom for everyone to follow.

Retrieved from: http://blackdeer.edublogs.org/2012/11/05/learning-goals-and-success-criteria/
Learning
goals and success criteria go together like peanut butter and jelly so they're essential to each other. Learning
goals are short statements that address the KDB of the lesson or unit of study
(Drake, Reid, and Kolohon, 2014). A learning goal should address the simple
question “what are we learning?” and derive from curriculum expectations.
However, they are not simply copy and pasted statements but rather thoughtful
statements that divide the unit into learnable chunks where each child can
reach the goal at their own pace. Success criteria are the skills needed to
complete the learning goal and answer the question “what am I looking for?”
(Drake et al., 2014). So for example, a learning goal could be “learning to
write a scary short story” and the success criteria could be things like
“having cliff hangers, using scary verbs and adjectives, having characters,
etc.” To avoid any power imbalances between teacher and student (which is usually avoided through assessment of learning and assessment as learning), the learning the
goals and criteria need to be written in student friendly language and make
learning attainable and reasonable (Drake et al., 2014). Students can take
charge of their own learning by offering ideas of what they deem successful,
collaborating with peers and teachers to form a plan, and have the ability to
change the criteria as the unit progresses (Drake et al., 2014). The learning
goals and success criteria are on a kind of continuum where knowledge is
co-constructed by teachers and students and eventually leads to students creating
individual goal setting (Drake et al., 2014). This way students are making real
connections with what they are learning and can understand the assessment process.
Often what happens in schools is that students don’t know how to be successful
because they are not included in the discussion of how to assess. When students
are involved in the process they are more likely to strive for success because
it is partly based on what they think success is (which is a relative term
anyway right?).

Retrieved from: http://www.bestcollegesonline.com/blog/2012/03/28/5-simple-ways-adjuncts-can-help-each-other/
A great way to assess progress in relation to the
learning goal is through exit cards. When students have a clear understanding
of what they are supposed to learn they are able to track their progress toward
achieving the goal (Learning Goals & Success Criteria, 2010). By asking
students to submit exit cards they are able to reflect on the progress they
have made towards their goals and what they can do to continue on the right
path (Learning Goals & Success Criteria, 2010). I would personally use this
kind of assessment in my classroom because it is a great way to track their
learning. Sometimes when setting goals people forget things along the way or
their thoughts change on what their goal should be. By creating exit cards it
can help students further internalize and personalize their learning goal,
making it more likely to be achieved (Learning Goals & Success Criteria,
2010).
In my own personal experience I have rarely been in
a classroom that allows students to be part of the assessment process. It was
always about having the teachers teach at us which left us excluded in this
part of education. I think learning goals, success criteria and the
co-construction that goes along with it allows for great repoire between
teachers and students. Furthermore, it gives students a sense of empowerment
and independence in their learning experience which is something they rarely
get but it can affect how seriously they take their education. Finally, the
feedback would be much accurate through this method because the teacher and the
student are on the same page about what success means and how they can
accomplish it.
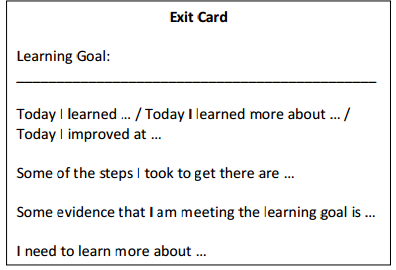
Retrieved from:: http://www.edugains.ca/resourcesAER/VideoLibrary/LearningGoalsSuccessCriteria/LearningGoalsSuccessCriteriaViewingGuide2011.pdf
Finally, if you’re ever unsure about when to
implement this kind of assessment, just ask yourself these three questions
(Davis & Herbst, 2013):
1.
When could I co-construct criteria? How
can I use examples to support an understanding of success so the criteria are
better?
2.
How can I involve students in using
criteria as a guide for self-assessment, peer assessment, and as a way to
monitor the progress of their learning?
3.
How can learners show proof of learning
from the co-constructed criteria?
If you would like to understand more about learning goals and success criteria, check this out!
References
Davis, A., & Herbst, S. (2013). Co-constructing success
criteria: Assessment in the service of
learning. Retrieved from http://www.cea-ace.ca/education-canada/article/co-constructing-success-criteria
Drake, S. M., Reid, J. L., & Kolohon, W. (2014). Interweaving
Curriculum and Classroom
Assessment: Engaging the 21st Century Learner. Don Mills, ON: Oxford
University
Press.
Exit Card (2010). Retrieved
/LearningGoalsSuccessCriteriaViewingGuide2011.pdf
GROWING SUCCESS: Assessment, Evaluation, and Reporting in Ontario
Schools. First
Edition, Covering Grades 1–12, 2010. Retrieved from
http://www.edu.gov.on.ca/eng/policyfunding/growSuccess.pdf
Helping Hands (2012). Retrieved from: http://www.bestcollegesonline.com/blog/2012/03/28/5-
simple-ways-adjuncts-can-help-each-other/
Learning Goals & Success Criteria (2010) Assessment for
learning video series. Retrieved from
rningGoalsSuccessCriteriaViewingGuide2011.pdf
Success Criteria (2012). Retrieved from http://blackdeer.edublogs.org/2012/11/05/learning-
goals-and-success-criteria/


